
by Jennifer Nash,
This article was originally written by Doug Short. From 2016-2022, it was improved upon and updated by Jill Mislinski. Starting in January 2023, AP Charts pages will be maintained by Jennifer Nash at Advisor Perspectives/VettaFi.
Note: The charts in this commentary have been updated to include the Q4 2022 advance estimate.
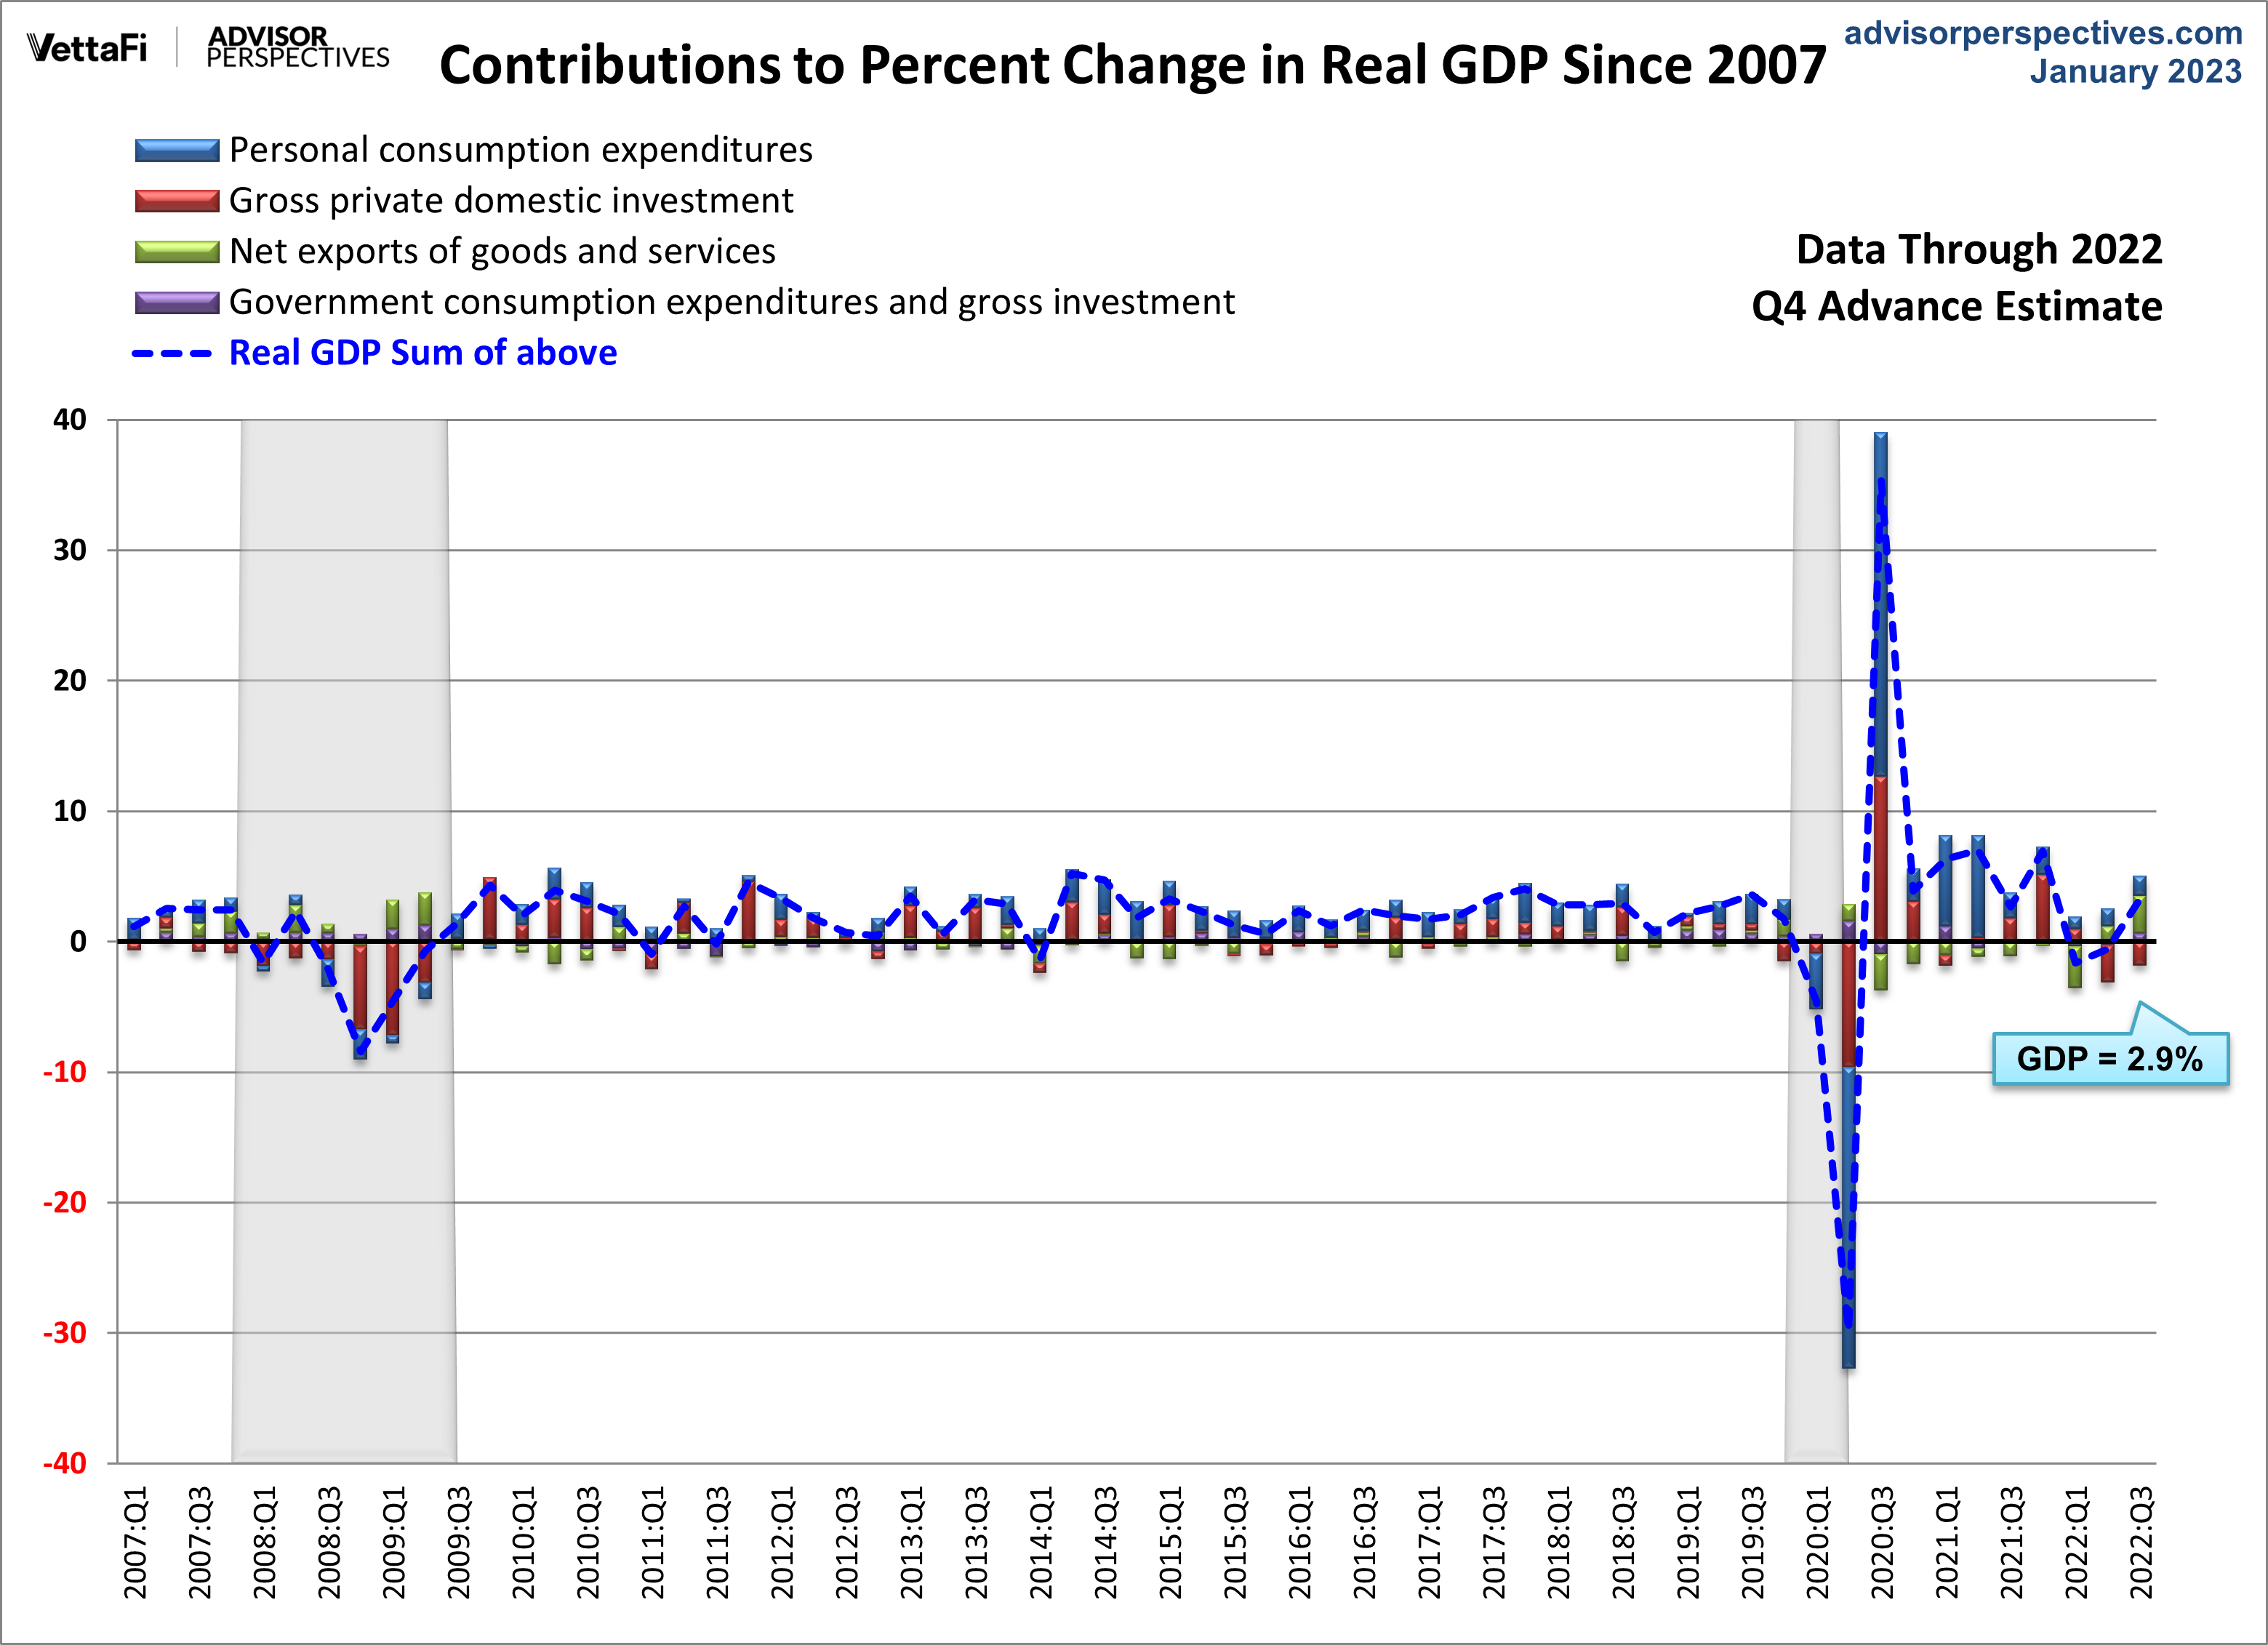
The chart below is a way to visualize real GDP change since 2007 and uses a stacked column chart to segment the four major components of GDP with a dashed line overlay to show the sum of the four, which is real GDP itself. Here is the latest overview from the Bureau of Labor Statistics:


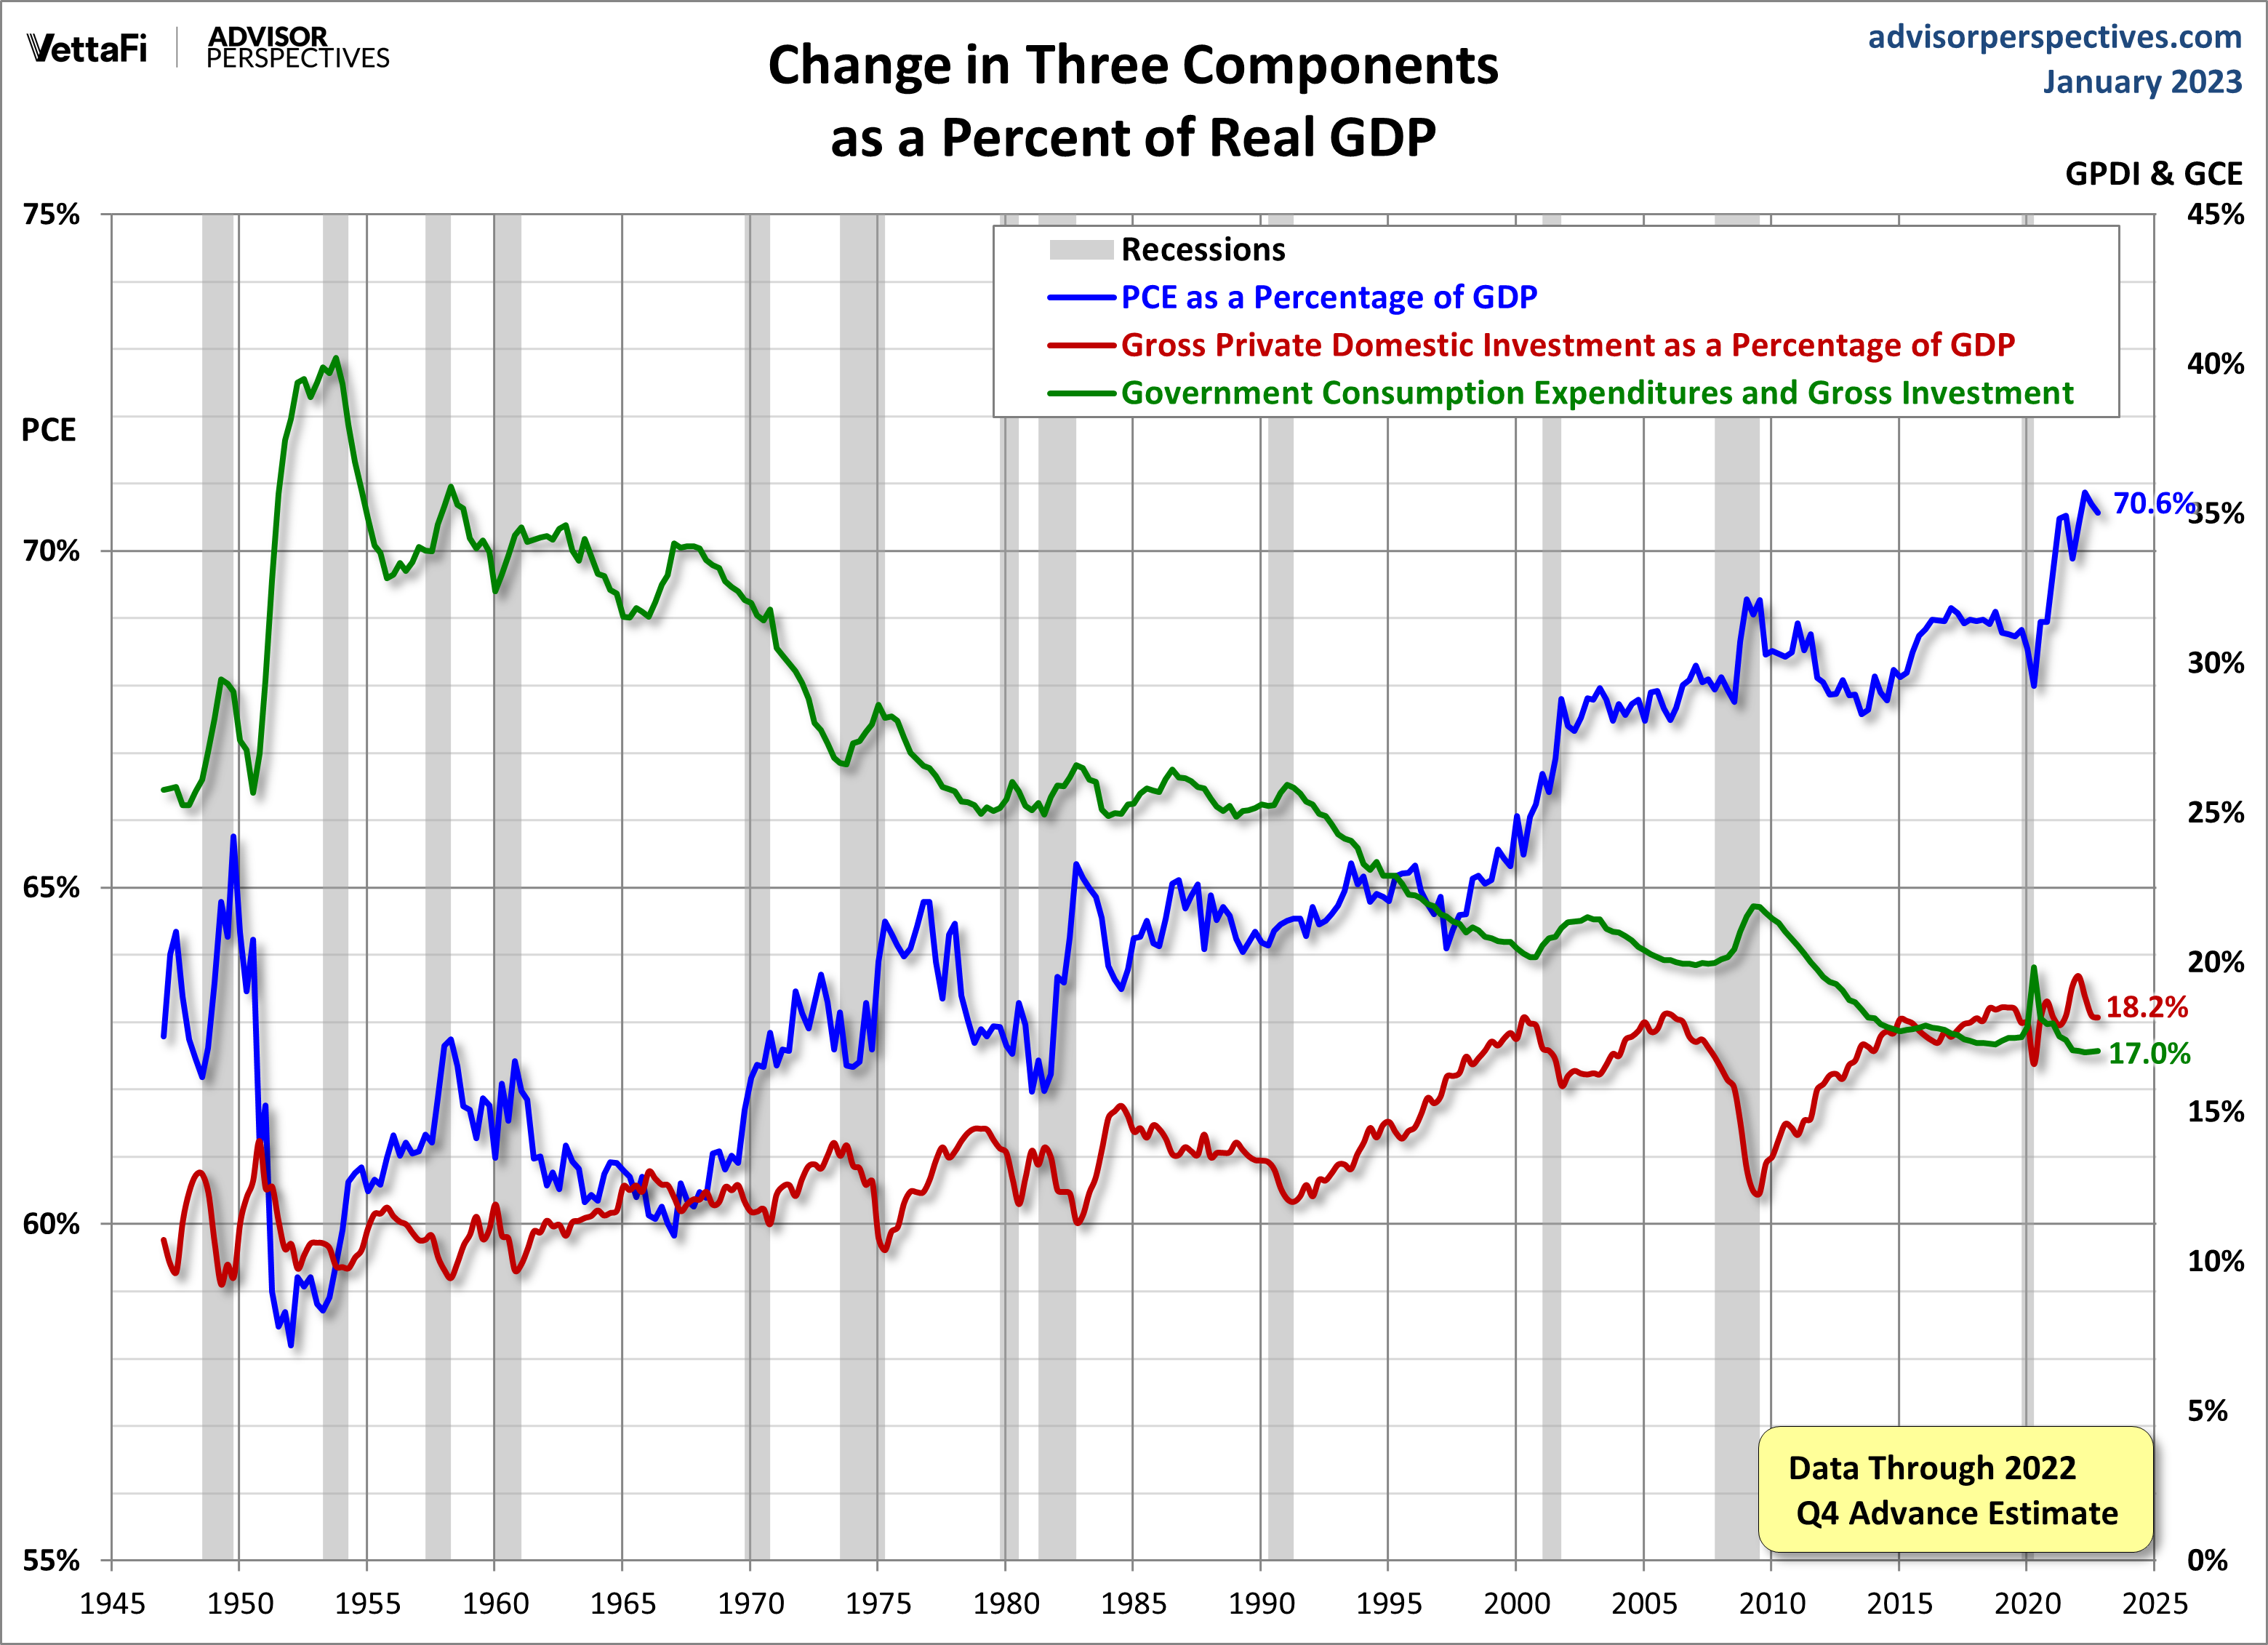
Let's close with a look at the inverse behavior of three of the GPDI components during recessions. PCE and especially GC generally increase as a percent of GDP whereas GPDI declines. Note the three with different vertical axes (PCE on the left, gross private domestic investment and government consumption on the right) to highlight the frequent inverse correlations.