Retail Sales Increased 3.0% in January


On a monthly basis, retail sales were up 3.0% from December to January (seasonally adjusted), and sales were up 6.4 percent from January 2022.


From the Census Bureau report:

Advance estimates of U.S. retail and food services sales for January 2023, adjusted for seasonal variation and holiday and trading-day differences, but not for price changes, were $697.0 billion, up 3.0 percent from the previous month, and up 6.4 percent above January 2022.
emphasis added
Retail Sales

This graph shows retail sales since 1992. This is monthly retail sales and food service, seasonally adjusted (total and ex-gasoline).

Retail sales ex-gasoline were up 3.2% in January.

The second graph shows the year-over-year change in retail sales and food service (ex-gasoline) since 1993.

Retail and Food service sales, ex-gasoline, increased by 6.8% on a YoY basis.

Year-over-year change in Retail SalesSales in January were well above expectations, however, sales in November and December were revised down, combined.


How Private Equity Fared in 2022 - Bloomberg


By many measures, private equity deal activity in 2022 slowed compared to the super-hot market seen in 2021. An analysis of deal volume and terminations, company valuations, the biggest players in the industry, and diversity among portfolio company founders paints a picture of last year’s PE market.

PE Investment Activity Dropped Off

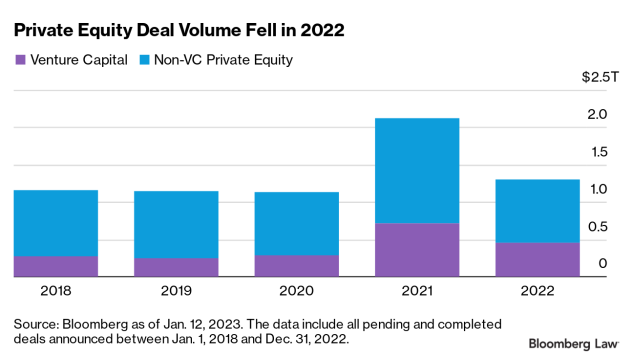
In 2022, the amount of mergers and acquisitions deal activity involving private equity parties fell by about a third year-over-year. Aggregate investments in the private equity corner of the M&A market saw YoY reductions of 38.6% to $1.30 trillion in 2022, down $820.5 billion from $2.12 trillion in 2021, according to Bloomberg data.

The entire M&A market saw a similar drop: A total of $3.6 trillion was invested in 2022—a reduction of $1.7 trillion or 31.2% from the $5.2 trillion high achieved in 2021.

Venture Capital Deals

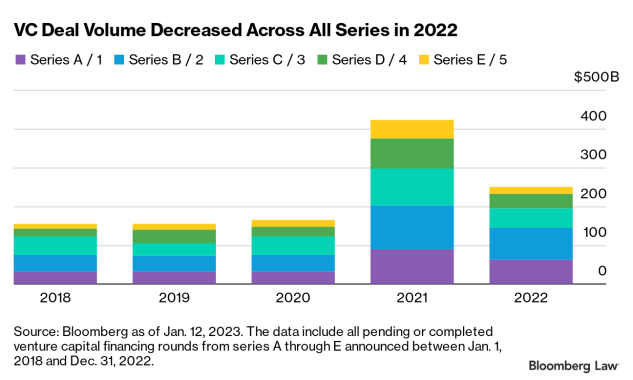
Across the venture capital landscape, Series A/1 funding rounds (the first round of capital raising efforts by companies with strong underlying ideas and developed business models) continued to account for the most common series of funding by deal count.

In 2022, venture capitalists invested $452.3 billion across approximately 16,000 deals. That marked a $260.9 billion, or 36.6%, pullback from the record-setting $713.0 billion invested in 2021.

Despite the decrease, VC deal activity remained healthy in 2022, historically speaking. 2023 could be a harder year for capital raising efforts by VC-backed companies, meaning they will likely need to consider alternative sources of capital like venture debt.

Portfolio Companies Lose Their Luster

As interest rates creep up and financial markets suffer heavy losses as a result, differences in valuation methodologies become evident between fund types. Mutual funds, which are required to disclose valuations of investment companies on a regular basis, have marked companies down at a far more aggressive rate than their more secretive counterparts—hedge funds.

A Bloomberg analysis of the valuations of 46 privately held companies with equity owned by both mutual and hedge funds showed that mutual funds marked down about 70% of the companies an average of 35% through September of last year. To see the difference in valuations by fund type, look no further than the valuations of the software company, Algolia, which lost 39% of its value according to mutual funds managed by Fidelity, despite being marked down just 9% by hedge fund firm Lone Pine, according to Bloomberg’s analysis.

Heavy Hitters

The list of the biggest players in private equity in 2022 comes as no surprise. According to Bloomberg data, Blackstone Inc topped the list of PE buyers, engaging in 60 deals valued at a total of $118.1 billion, including the largest deal in terms of announced value at $45.0 billion: the take private deal of Atlantia SpAKirkland & Ellis topped the Legal Adviser League Table, advising just over 13.5% of PE deals. Goldman Sachs topped the list of financial advisers in the space, having advised just over 23.5% of all deals.

Terminated Deals

According to Bloomberg data as of Jan. 11, 2023, terminations of PE deals were few and far between—an indication that dealmakers aren’t signing agreements that don’t instill a sense of confidence.

Of the 24,169 deals signed in 2022, just 18 deals valued at a combined $7.62 billion have been terminated thus far. Of deals signed in 2021, 43—worth a total of $53.9 billion—have been terminated.

Time will tell just how many 2022 deals will end in termination, but for now, deals announced last year have a low rate of termination. In fact, the last year in which fewer deals were terminated was 2013, in which 17 deals worth a total of $4.58 billion were terminated. That’s pretty remarkable considering that 2022 had 2.5 times the number of completed deals compared to 2013 by count.

Diversity in Private Equity

In the US, Black- and female-founded companies have made progress in the private equity space over the past several years in terms of the amount of capital they’ve raised each year in VC deals, but that amount remains low.

Black-founded startups raise about one-third of the venture capital as their counterparts, according to recent research. Consistent with these findings, just 1.0% of the total VC capital raised in 2022 was by Black founders, a slight decrease from 1.3% in 2021.

From Q1 to Q3 of 2022, companies founded by women closed more deal value than in any full year other than 2021, and companies founded by all-female teams raised $3.6 billion by Sept. 30, 2022, according to Crunchbase data. However, the figure pales in comparison to the $154.9 billion raised by their all-male counterparts.

Analysts and investors may take some solace knowing that deal activity really didn’t come to a screeching halt last year. However, the economy clearly pulled back, and volatility remained high compared to pre-pandemic levels, which leaves a giant question mark about what’s around the corner.

NAHB Housing Market Index: "Cautious Optimism for Builders in February"

The National Association of Home Builders (NAHB) Housing Market Index (HMI) is a gauge of builder opinion on the relative level of current and future single-family home sales. The data is collected from a monthly survey of about 900 home builders asking respondents to, "rate market conditions for the sale of new homes at the present time and in the next six months as well as the traffic of prospective buyers of new homes." It is a diffusion index, which means that a reading above 50 indicates a favorable outlook on home sales; below 50 indicates a negative outlook. The latest reading of 42 is up 7 from last month's 35, marking two consecutive months of gains.


Here's an excerpt from this morning's blog update:

Two consecutive solid monthly gains for builder confidence, spurred in part by easing mortgage rates, signal that the housing market may be turning a corner even as builders continue to contend with high construction costs and building material supply chain logjams. Builder confidence in the market for newly built single-family homes in February rose seven points to 42, according to the National Association of Home Builders (NAHB)/Wells Fargo Housing Market Index (HMI) released today. This is the strongest reading since September of last year.


“With the largest monthly increase for builder sentiment since June 2013*, the HMI indicates that incremental gains for housing affordability have the ability to price-in buyers to the market,” said NAHB Chairman Alicia Huey, a custom home builder and developer from Birmingham, Ala. “The nation continues to face a sizeable housing shortage that can only be closed by building more affordable, attainable housing. However, the two monthly gains for the HMI at the start of 2023 match the cautious optimism noted by the large number of builders at the recent International Builders’ Show in Las Vegas, who reported a better start to the year than expected last fall.”


*Largest monthly increase since June 2020


Here is the historical series, which dates from 1985.


Current State of the Housing Market: Overview for mid-February


A brief excerpt:

Here is a graph of new listing from Realtor.com’s January Housing Trends Report showing new listings were down about 5% year-over-year in January. Although new listings are at a record low for January, the year-over-year decline was smaller in January than in Q4 2022. From Realtor.com:
In January, the number of homes newly-listed for sale declined by 5.4% compared to the same time last year. This is a much lower rate of decline than last month’s 21.0% decrease and November’s 17.2% decrease. However, new listings remain 25.0% below pre-pandemic 2017 to 2019 levels.
New ListingsAnd the local markets I track that have reported so far, show new listings were down less in January than in December.
For these areas, new listings were down 9.2% YoY. … Last month, new listings in these markets were down 21.7% YoY.  This is a significantly smaller YoY decline in new listings, and something to watch.

Industrial Production Unchanged in January


From the Fed: Industrial Production and Capacity Utilization

Industrial production was unchanged in January after falling 0.6 percent and 1.0 percent in November and December, respectively. In January, manufacturing output moved up 1.0 percent and mining output rose 2.0 percent following two months with substantial decreases for each sector. The output of utilities fell 9.9 percent in January, as a swing from unseasonably cool weather in December to unseasonably warm weather in January depressed the demand for heating. At 103.0 percent of its 2017 average, total industrial production in January was 0.8 percent above its year-earlier level. Capacity utilization declined 0.1 percentage point in January to 78.3 percent, a rate that is 1.3 percentage points below its long-run (1972–2022) average.
emphasis added
Capacity UtilizationClick on graph for larger image.

This graph shows Capacity Utilization. This series is up from the record low set in April 2020, and above the level in February 2020 (pre-pandemic).

Capacity utilization at 78.3% is 1.3% below the average from 1972 to 2021.  This was below consensus expectations.

Note: y-axis doesn't start at zero to better show the change.


Industrial ProductionThe second graph shows industrial production since 1967.

Industrial production increased slightly in January to 103.0. This is above the pre-pandemic level.

The change in industrial production was below consensus expectations.